Running Agents in Production: Observability, Cost, and Maintenance (NCP-AAI Module 11)
This is Module 11 of NCP-AAI Mastery, a free 14-module course that takes you from your first agent to NVIDIA-certified. Start at Module 1 or browse the full syllabus.
Scout has been deployed since Module 10. The API answers, the container is healthy, the infrastructure dashboard is a wall of green. Then a user writes in: “the reports have been citing nonsense since Tuesday.” The logs show no errors — not one exception since Friday’s deploy. So what moved? The hosted model? A key source site? Friday’s prompt edit? Three suspects, zero evidence, and one tempting bad idea: redeploy something and hope.
That gap — between “the service is up” and “the agent is doing its job” —
is what this module closes. By the end, the Tuesday question takes five
minutes: open the trace, read the run span by span, check the eval-score
timeline against the deploy markers — in our setup, the points where
prompt_version or the git sha changes on the score timeline. Deploying
was day one. This is day
two — and day two is the rest of the agent’s life.
In this module
- You’ll learn:
- Instrument an agent end to end: one trace per run, one span per node, with Langfuse (SDK v4).
- Define the metrics that matter — task success, cost per request, p95 latency, tokens per node — and diagnose a failure from a trace, symptom to faulty span.
- Detect drift and regressions: continuous evaluation on the Module 8 golden set, benchmarked against prior versions.
- Operate an agent people can trust: versioning, runbooks, incident response.
- You’ll build: full tracing for Scout (one span per node), a per-node cost/latency report, and a continuous-eval monitor that raises an alert when report quality drops.
- Exam domains covered: D8 — Run, Monitor, and Maintain — 5% of the exam.
- Prerequisites: Modules 1–10 (Scout deployed as an API); NVIDIA API key; a free Langfuse Cloud account, created during the lab.
Where you are
- ✅ Modules 1–7 — first NIM call to full supervisor team
- ✅ Module 8 — eval harness: golden set + LLM-as-judge
- ✅ Module 9 — guardrails + human plan approval
- ✅ Module 10 — deployed: FastAPI, Docker, async jobs
- 👉 Module 11 — Running agents in production (you are here)
- ⬜ Modules 12–14 — NVIDIA stack, capstone, the exam
Scout before: deployed but opaque — a job goes in, a report comes out, everything between is faith. Scout after: every run is a readable trace, every node has a token and latency price, and an automated monitor re-scores report quality continuously — and rings before your users do.
Day 2 operations: why shipping was the easy part
A deployed agent breaks in three ways, not equally visible:
- It goes down. Crashes, OOM, unreachable endpoint. Loud — Module 10’s healthcheck already catches it.
- It slows down or costs too much. Latency creeps, token spend swells. Quieter, but measurable with classic tooling.
- It degrades silently. The service stays up, latency stays flat — and the output quality erodes. No exception, no log line. Nothing in the infrastructure layer even knows what “a bad research report” is.
The first two are classic SRE (site-reliability-engineering) territory. The third is what makes agents special — a probabilistic system whose inputs (the live web) and engine (a hosted model) both change without your consent — precisely what Domain 8 tests. Observability is the property that makes all three diagnosable: you can understand the system’s internal behavior from the telemetry it emits, without shipping new code to ask new questions.
It rests on three signals, and the exam expects you to keep them straight:
| Signal | Question it answers | Scout example | Where it lives in our stack |
|---|---|---|---|
| Logs | ”What happened at this instant?” — discrete events | uvicorn access lines; the Module 9 audit entry “plan approved” | stdout / audit.py JSONL |
| Traces | ”How did this run unfold, and where did it go wrong?” — causality | One job: Planner → approval → Searcher → Reader → Fact-checker → Writer, every LLM call nested | Langfuse |
| Metrics | ”How is the system trending?” — aggregates | p95 latency, cost per run, mean eval score this week vs. last | Langfuse dashboards + monitor scores |
Tracing agent runs end to end
Two definitions from the vocabulary of OpenTelemetry, the open standard for emitting traces, metrics, and logs. A trace is the complete record of one request’s path through your system — for Scout, one research run from question to cited report. A span is one unit of work inside a trace — a node executing, an LLM call, a tool call — with a start time, a duration, and a parent, so spans nest into a tree.
Why is tracing the signal for agents? Because an agent run is non-deterministic and deep: one Scout job is seven nodes — a supervisor, four specialists, plus planner and critic — and ten to twenty LLM calls, no two runs alike. A linear log can’t show you that the Writer hallucinated because the Fact-checker passed an unverified claim because the Reader extracted boilerplate because the Searcher picked a parked domain. A trace tree shows exactly that chain — one span per node, the LLM calls (generations) nested inside.
For the dashboard we use Langfuse: open source (MIT), self-hosted or cloud, v4 Python SDK rebuilt on OpenTelemetry in March 2026 — so any pre-2026 snippet you find online uses an API that no longer exists; write against the v4 docs. LangSmith is the managed alternative, with a tighter free tier (5k traces/month vs. Langfuse’s 50k units/month, as of June 2026). Its observability-concepts page is the successor to the tracing doc the official study guide recommends for this domain — see the references.
What separates a trace you can read from one you can use is metadata.
Every Scout trace is stamped with thread_id (which job), model name, a
prompt_version string, and the git sha — the four fields that turn
“quality dropped” into “quality dropped for runs after prompt_version
m8-tuned-2”, and the hooks objectives 8.3 (benchmark against prior
versions) and 8.4 (versioning in production) hang on.
Here’s the full loop this module builds — a loop, not a pipeline:
flowchart LR
    A["API run<br/>(POST /research)"] --> B["Trace: one span per node<br/>Planner · Critic · Supervisor ·<br/>Searcher · Reader · Fact-checker · Writer"]
    B --> C["Langfuse dashboard<br/>cost · latency · quality"]
    D["Continuous-eval monitor<br/>golden-set subset + judge"] --> C
    D -->|"score < threshold"| E["ALERT"]
    E --> F["Runbook<br/>symptom → checks → actions"]
    F --> G["Versioned fix<br/>prompt_version + git sha"]
    G --> H["Redeploy behind<br/>a regression gate"]
    H --> A
The observability loop: runs feed the dashboard, the monitor guards quality, alerts route through a runbook to a versioned fix — which the next traces verify.
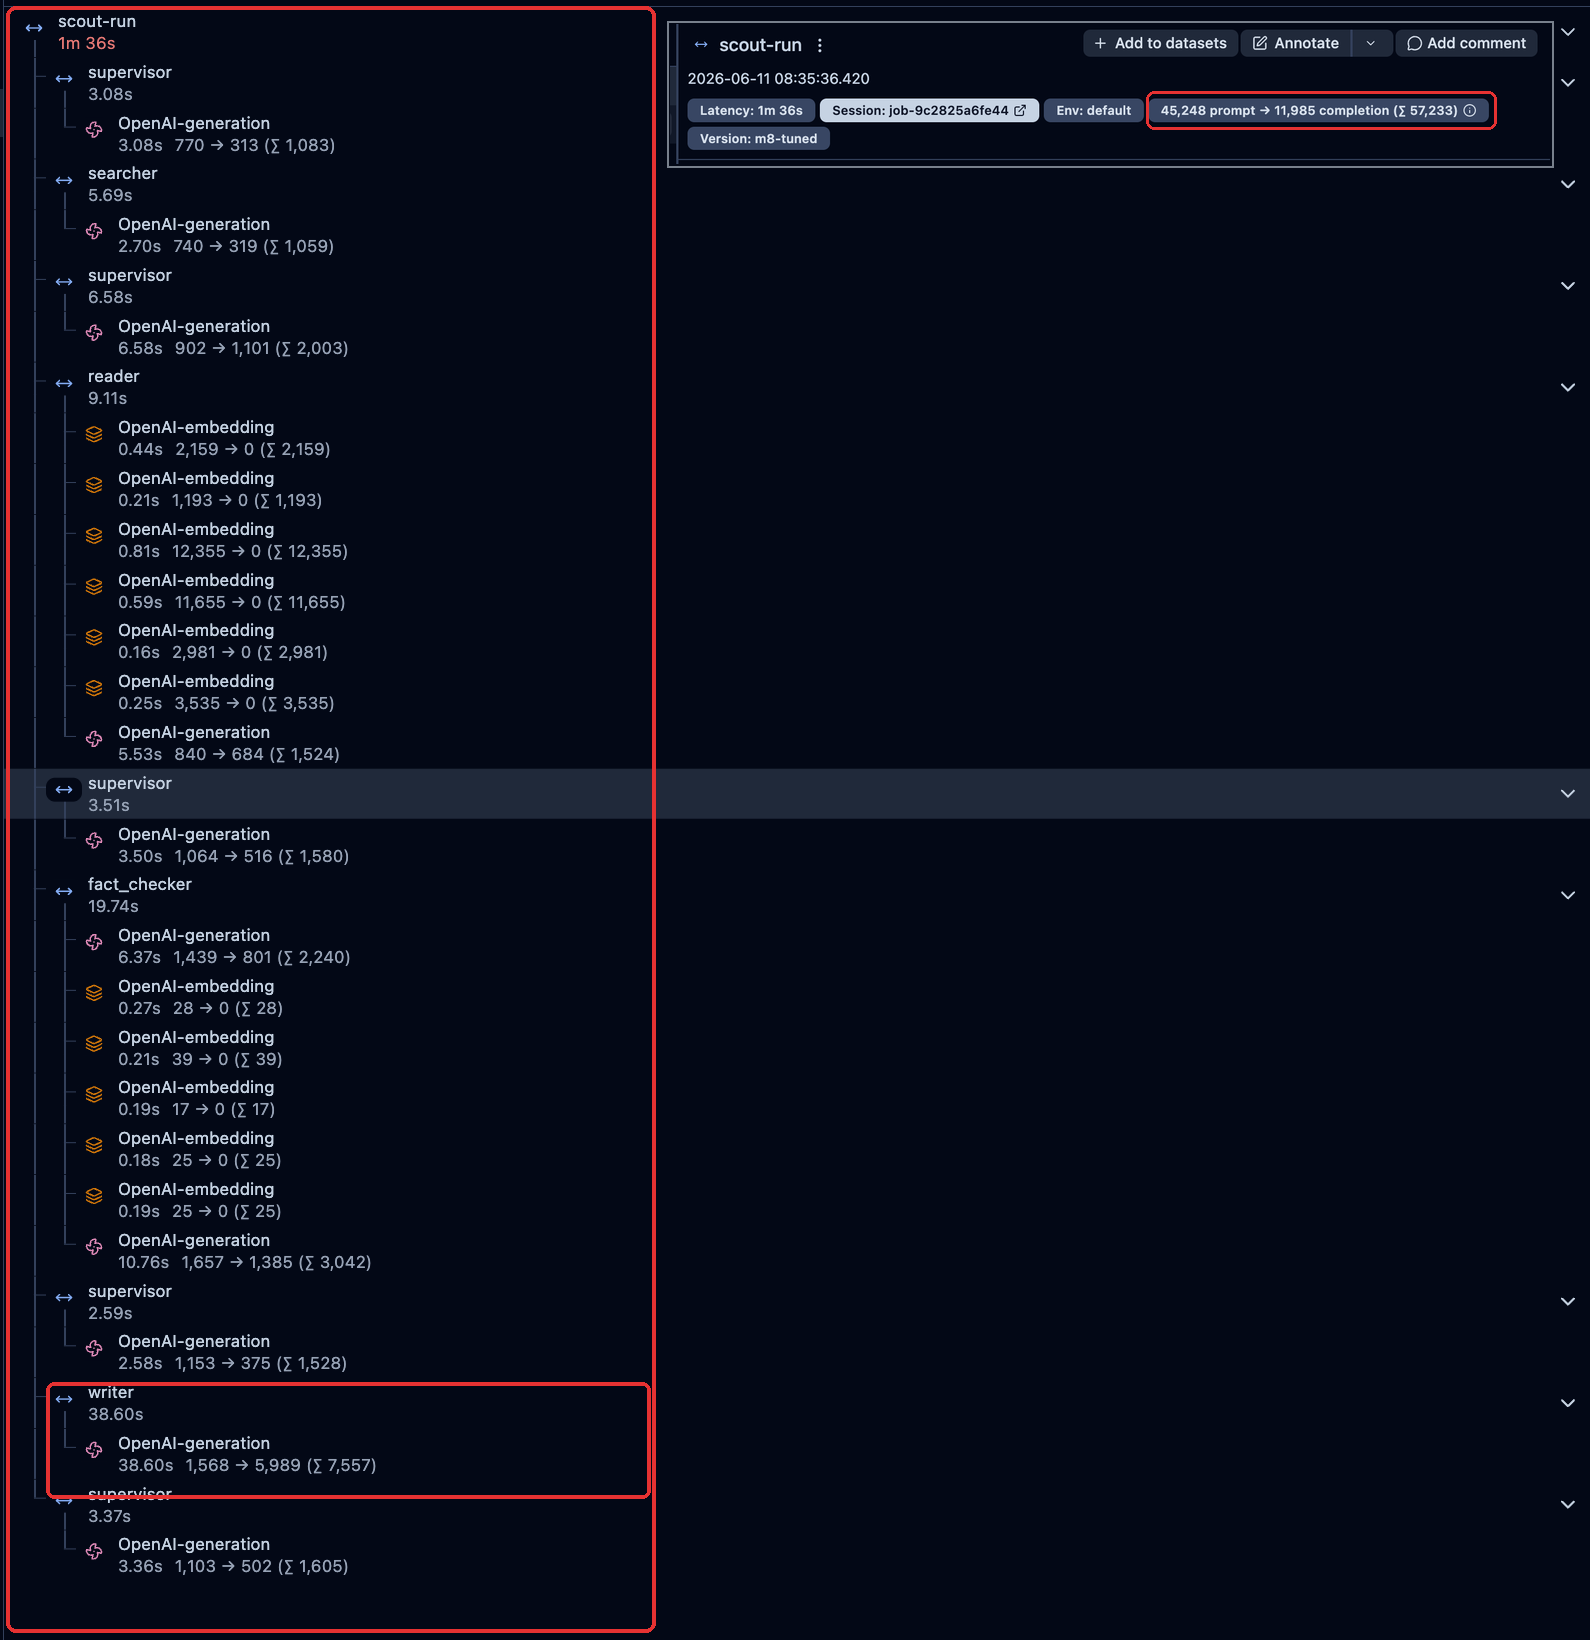
A real Scout research run in Langfuse (June 2026): one span per node — five supervisor turns, searcher, reader, fact-checker, and the writer’s single 38.6-second drafting call — with the run’s token totals inset.
The metrics that matter: cost, latency, quality
Objective 8.1 asks you to define monitoring dashboards and reliability metrics. The trap: the obvious dashboards — CPU, memory, request counts — describe the service, not the agent. The metrics that tell you whether Scout is doing its job are product metrics:
- Task success rate — the fraction of jobs ending in
donewith a usable report, rather thanfailedor abandoned at approval. - Cost per request — in tokens first, the unit you control and the provider bills in; dollars second, through a price table you own.
- p95 latency — the latency below which 95% of runs finish. Averages hide outliers; p95 shows what your unlucky users experience, so dashboards lead with it, not the mean.
- Tokens per node — the cost X-ray: which specialist eats the budget.
- HITL (human-in-the-loop) approval rate — how often humans approve the plan unedited (Module 9); falling means the Planner is drifting from what users want.
- Mean eval score — the judge’s grounding/coverage/citations aggregate over time. The quality heartbeat.
The split that Domain 8 scenarios test, in one table:
| Metric | What a regression looks like | Detected by | Who cares |
|---|---|---|---|
| Uptime / error rate | 5xx spike, healthcheck failing | Infra monitoring (free with Module 10) | Ops, immediately |
| p95 latency | Runs taking 2× longer this week | Trace durations, aggregated | Users, product |
| Cost per request | Token spend per run climbing | Per-node usage from traces | Whoever pays the bill |
| Task success rate | More failed jobs, abandoned approvals | API job states + traces | Product, support |
| Eval score (grounding, citations) | Reports citing sources that don’t support claims | Continuous evaluation — this module | Users, before they tell you |
Read the “Detected by” column closely: the first rows come essentially free with any deployed web service. The last rows exist only if you build them — no infrastructure tool will ever emit a “grounding declined” alert, because no infrastructure tool knows what grounding is.
Where does the money go in a multi-agent system? From running Scout and systems like it: Reader and Writer dominate token spend — long inputs (ingested pages) and long outputs (the report, plus a reasoning model’s thinking tokens) — while the supervisor spends little per call but calls constantly: the per-hop coordination tax you accepted in Module 3 for auditability. Opinion from experience, not a benchmark; the lab’s per-node report is how you learn your mix instead of trusting mine.
Drift, regressions, and continuous evaluation
Drift is quality change without a deployment: your code didn’t move, and the system got worse anyway — the defining maintenance problem of agents, whose behavior depends on things you don’t control. The taxonomy worth memorizing:
| Drift type | Cause | Symptom | Detection | First response |
|---|---|---|---|---|
| Model drift | Provider updates the hosted model behind the same API | Tone, format, or accuracy shifts; nothing in your diff | Eval score drops with no deploy marker in sight | Full eval to size it; pin or switch the model; re-tune prompts |
| Source drift | The web changes — sites restructure, block fetchers, decay | Grounding and citation scores sag; Reader spans full of boilerplate | Per-metric eval scores + Searcher/Reader spans | Fix retrieval/extraction for the offending sources |
| Prompt/config regression | Your own deploys | Quality drops at a deploy marker | Scores tagged by prompt_version / git sha | Roll back, then fix forward behind a regression gate |
| Tool drift | A third-party API changes or degrades | Tool-call spans erroring or returning junk | Tool span errors and latency in traces | Adapt the tool wrapper; cap or fail over |
Scout is exposed to source drift by construction — it reads the live web — and to model drift like every system on a hosted endpoint: the model is not a frozen artifact on your disk.
The detection column keeps saying “eval scores” — this module’s core
practice. Continuous evaluation is running your evaluation harness
against the live, deployed agent on a schedule rather than once before
release — same golden set, same judge, scores tracked over time and
alarmed against a threshold. Evaluation stops being a release ritual and
becomes a production sensor. Objective 8.3’s “benchmark against prior
versions” turns precise and cheap: every score carries prompt_version,
model, and git sha, so “did v2 regress against v1?” is a query over stored
results — not an opinion, a diff.
Versioning in production (objective 8.4) follows directly. Three things
get versioned, and all three ride on every trace: prompts (a
PROMPT_VERSION constant, bumped on every edit), model config, and code
(git sha). Read the study guide’s “automated tuning, retraining, and
versioning” honestly: for an LLM agent, the automated part that’s real
today is the loop — alert → diagnose from the trace → fix → a CI
regression gate that blocks the deploy if golden-set scores drop.
Retraining applies when you own model weights; with hosted Nemotron
endpoints the lever is fine-tuning a custom variant — NeMo Customizer
territory, Module 12.
Uptime, transparency, and trust (objective 8.5) wraps it all. Expose status honestly (Module 10’s job states do half of this); keep the audit trail of who approved what (Module 9); publish quality scores so “is the agent OK?” has a shared answer. And write the runbook: the document that turns an alert into action — symptom, checks in order, actions, escalation — written before the incident and versioned next to the code it describes. The lab ships one with three scenarios; the anatomy matters more than the specifics.
Hands-on lab: build it
Objective: instrument Scout end to end, price each node, stand up the
quality alarm. Observable result: a research job yields a full trace
(one span per node); uv run python -m scout.costs --last-run (from
module-11/) prints the cost table; uv run python -m evals.monitor
prints a quality score and exits non-zero
with an ALERT: line below threshold. Full code:
module-11/.
Step 1 — Keys and the v4 SDK
Create a free Langfuse Cloud account and a project, then put its keys in
the repo-root .env (same place as your NVIDIA key — never committed):
# .env (repo root)
LANGFUSE_PUBLIC_KEY=pk-lf-...
LANGFUSE_SECRET_KEY=sk-lf-...
LANGFUSE_BASE_URL=https://us.cloud.langfuse.com   # match your region
uv add "langfuse~=4.7"Self-hosting is one docker compose up if traces can’t leave your infra —
same code, different URL. And the keys are optional by design: every
hook below degrades to a clean no-op without them; skipping the account
costs you the dashboard and nothing else.
Step 2 — The one import swap
Scout’s nodes call the raw openai SDK — Langfuse’s LangChain callback
integration would see nothing. The right tool is the drop-in client:
same constructor, same API, every call recorded as a generation. One file
changes — scout/llm.py, the single client factory since Module 1:
def get_client() -> observability.MeteredClient:
    config.load_env()
    api_key = os.environ[config.API_KEY_ENV]
    if observability.tracing_enabled():
        # Langfuse v4 drop-in: identical constructor and call surface.
        from langfuse.openai import OpenAI as TracedOpenAI
        client = TracedOpenAI(base_url=config.BASE_URL, api_key=api_key)
    else:
        client = OpenAI(base_url=config.BASE_URL, api_key=api_key)
    return observability.meter(client)
The import is conditional and lazy: no keys, no langfuse import at all.
The meter(...) wrapper is our local bookkeeper — one row per LLM call
(node, model, tokens, seconds) appended to runs/last_run.jsonl, so the
cost report works without a Langfuse account. For streamed calls it
requests usage (stream_options={"include_usage": True}) and swallows the
extra usage-only chunk.
Step 3 — A span per node, a trace per run
The new scout/observability.py adds two hooks. First, a decorator — two
added lines per node file, names canonical. Below, scout/agents/searcher.py;
planner.py and supervisor.py sit one level up (the import becomes
from .observability import trace_node), and planner.py hosts two
nodes — planner and critic — so it gets two decorators:
from ..observability import trace_node  # Module 11

@trace_node("searcher")
def searcher_node(state: ScoutState) -> dict:
    ...
Under tracing it wraps the node with the v4 observe decorator —
capture_input/output=False, because Scout’s state carries whole fetched
pages: trace bloat and a PII surface. Always, it records which node is
running, so usage rows are attributed per node. Second, the return of
build_graph() in scout/graph.py, wrapped:
return observability.instrument_graph(
    builder.compile(checkpointer=checkpointer or memory.get_checkpointer())
)
instrument_graph wraps the compiled graph so every invoke/stream runs
inside one root span — one trace per run — stamped with the metadata:
thread_id (the job id, from the LangGraph config), model name,
PROMPT_VERSION (new in config.py), git sha. The CLI, the Module 10 API,
and the eval harness all get the graph from build_graph(), so this line
instruments every entry point — the API needs no edits. A run that pauses
at plan approval and resumes later becomes two trace phases sharing the
same thread_id session.
Now feed it: run a research job through the API — Module 10’s flow,
unchanged (from module-11/, uv run uvicorn scout.api.main:app --port 8000, then POST /research) — and open your Langfuse project: one trace,
a span per node, the generations nested inside — and the dashboard view is
the screenshot above.
Step 4 — The per-node cost report
config.py gains MODEL_PRICES — per-1M-token (input, output) prices,
illustrative values only, since build.nvidia.com publishes no per-token
price on the free tier as of June 2026. Your contracted rates go there.
This step and the next run from module-11/ — the scout and evals
packages resolve from there:
cd module-11
uv run python -m scout.costs --last-run
Run log: runs/last_run.jsonl — 15 LLM call(s)
node calls in tok out tok est. $ sec
----------------------------------------------------------
supervisor 6 5963 4648 0.0049 28.7
writer 1 2780 6119 0.0055 30.2
fact_checker 2 4021 2632 0.0029 21.7
planner 2 1141 2449 0.0022 12.9
reader 2 1360 1905 0.0018 12.5
critic 1 583 718 0.0007 5.1
searcher 1 672 151 0.0003 1.3
----------------------------------------------------------
TOTAL 15 16520 18622 0.0182 112.5
Prices are the ILLUSTRATIVE config.MODEL_PRICES table — set your contracted rates there.Numbers vary run to run; the shape is the lesson. Here the Writer is the heaviest single call — a reasoning model drafting the full report — and the supervisor’s six small turns add up to the top line: Module 3’s per-hop coordination tax, priced. More fetching pushes the Reader up the table.
Step 5 — The quality alarm
evals/monitor.py replays the first five golden-set questions — the
same five every time, or scores stop being comparable — through the same
graph the deployed API serves (in-process via build_graph(), not through
the HTTP endpoint: same model, prompts, and config, so the same measured
quality), grades each report with the Module 8 judge, logs the score onto
the question’s trace, and applies a threshold:
uv run python -m evals.monitor --threshold 0.7Monitor: 5 fixed question(s), model nvidia/nemotron-3-nano-30b-a3b, prompt_version m8-tuned
[1/5] What is the Nemotron Coalition that NVIDIA announced at GTC 2026?
[r01] 136.8s, 13 node visits, 4 worker turns
[r01] checks: all green
[r01] judge: grounding=5 coverage=3 citations=5
...
Monitor score: 0.733 (threshold 0.70, run 'monitor-20260611T123858Z')
grounding 4.20 / 5
coverage 2.60 / 5
citations 4.20 / 5
OK: quality above threshold.A healthy pass exits 0. To watch the alarm fire without paying for five more runs, re-score the same results file — zero network calls — with the bar raised above the measured score:
uv run python -m evals.monitor --from-results \
  evals/results/run-monitor-20260611T123858Z.json --threshold 0.8
ALERT: report quality 0.733 is below threshold 0.80 — open runbook.md, scenario 1.Exit code 2 — a cron job keys off that; no Slack integration required for a working alarm. Why five questions, not fifteen? One pass is already five full multi-agent runs plus five judge calls under a 40 req/min rate limit (as of June 2026). The 15-question eval stays what it was in Module 8: the deep check before a release, not the hourly heartbeat.
Step 6 — The runbook and the tests
module-11/runbook.md ships three scenarios — eval score dropping, p95
rising, cost per run rising — each symptom → checks → actions → escalate.
Read scenario 1 before your first alert, not during it. Then verify:
cd ..                                                # back to the repo root
uv run pytest module-11/tests/                       # offline: no keys, no network
SCOUT_LIVE_TESTS=1 uv run pytest module-11/tests/    # + real traces + 1 traced LLM call
Try it yourself (no solution provided):
- CI quality gate. A GitHub Actions workflow on a
schedule:cron that runs the monitor and fails the build on exit code 2 — an alarm that rings before your users do. - Budget alert. Add a
--max-tokens Nflag toscout/costs.pythat exits non-zero when a run blows the budget; same cron. Cost regressions are regressions.
Exam corner
What the exam tests here. Per the official study guide, Domain 8 — Run, Monitor, and Maintain (5% per the certification page) — expects you to: define monitoring dashboards and reliability metrics (8.1); track logs, errors, and anomalies for root-cause diagnosis (8.2); continuously benchmark deployed agents against prior versions (8.3); implement automated tuning, retraining, and versioning in production (8.4); and ensure continuous uptime, transparency, and trust (8.5). This module also owns the monitoring half of objective 4.2 (MLOps: CI/CD, monitoring, governance); the deployment half lives in Module 10.
Quiz — answers after question 6.
-
You’re designing the first dashboard for a research agent behind an API. Which metric set serves a deployed agent best?
- A) CPU, memory, disk, and container uptime
- B) Requests per day, unique users, and sign-up conversion
- C) Task success rate, cost per request, and p95 latency, alongside error rate and uptime
- D) Total monthly token consumption, as one number
-
A multi-step agent’s failure rate spikes overnight. The logs show no exceptions, no timeouts. What’s the right first move?
- A) Restart the service and watch whether the rate recovers
- B) Pull traces of failed runs and read them span by span to find where failing runs diverge from healthy ones
- C) Raise the model temperature so the agent can explore alternatives
- D) Double the request timeout and add a retry
-
Your team swaps the agent’s model for a newer one. The PM asks: “did quality regress?” The strongest answer:
- A) Wait two weeks; if no complaints arrive, quality held
- B) Have an engineer ask the new version a few questions and compare by feel
- C) Route 50% of traffic to each version, no metric defined, and watch
- D) Run the golden-set evaluation on the new version and compare against the previous version’s stored baseline
-
Prompts get edited weekly, and nobody can connect production behavior changes to specific edits anymore. What fixes this?
- A) Version prompts and config, stamp the version onto every trace, and gate deploys with a regression eval
- B) Freeze the prompts permanently — stability beats improvement
- C) Turn on DEBUG logging so every prompt is logged in full
- D) Keep prompts in a shared document and announce edits in standup
-
Uptime is 100%, latency is stable — and users have been unhappy with answer quality since the provider updated its hosted model. What was missing?
- A) More replicas, to rule out load-related degradation
- B) Finer-grained infrastructure monitoring on the inference path
- C) Continuous evaluation on a fixed golden set — quality monitoring is the only signal that catches silent model drift
- D) Automatic retries on every model call
-
Your eval monitor runs every few hours against the live agent. To keep scores meaningful and the budget sane, each pass should replay:
- A) A freshly generated set of questions, to avoid overfitting
- B) A fixed subset of the golden set, graded by the same LLM-as-judge, so scores stay comparable over time at a fraction of the cost
- C) The full golden set every pass — anything less is a blind spot
- D) One report manually reviewed by a human each day
Answers. 1 — C. An agent dashboard mixes product metrics (success, cost/request, p95) with baseline infra. A is infra-only — blind to quality and cost; B is vanity; D is one aggregate with no diagnostic power. 2 — B. Silent logs + multi-step failure is the textbook cue for traces: only span-level causality localizes the faulty node. A destroys evidence, C adds randomness, D treats an unknown cause. 3 — D. Objective 8.3 verbatim: benchmark continuously against prior versions — stored, versioned scores on the same question set. A outsources QA to angry users; B isn’t reproducible; C has no metric. 4 — A. Versioning + trace tagging + a regression gate is objective 8.4 operationalized. B trades the problem for stagnation; C logs content, not causality, and bloats PII exposure; D is process theater. 5 — C. Model drift: the host updated the engine, nothing crashed, infra stayed green. Only quality monitoring sees it — A, B, D live in the layer that was provably fine. 6 — B. Scores are comparable only if questions and judge stay fixed; a subset keeps the cost of frequency sane. A breaks comparability; C burns ~3× budget for marginal signal; D doesn’t scale and isn’t a metric.
Traps to avoid:
- “Monitoring” ≠ infrastructure monitoring. For agents, quality metrics — eval scores, grounding, citation validity — are part of monitoring. A green infra dashboard proves the service is up, not that the agent is right. The most-played distinction in Domain 8 scenarios.
- Evaluation isn’t a pre-deployment phase. Objective 8.3 says continuously benchmark against prior versions — evaluation is an operations activity, not just a release gate.
- Tracing ≠ logging. A log is an isolated event; a trace reconstructs one run’s causality. When the question says “root cause” on a multi-step run, the answer involves traces — logs are supporting cast.
- Rollback without versioned prompts and config is a guess (8.4). If the trace doesn’t carry the version, you can’t connect behavior to change — and “instant rollback” stops being instant or trustworthy (8.5).
Key takeaways
- A deployed agent breaks three ways: down (infra), slow/expensive (perf), silently degraded (quality) — only the third is invisible to classic tooling.
- A trace reconstructs one run’s causality span by span; a log records isolated events; metrics aggregate. Root-cause questions point at traces.
- Agent dashboards lead with product metrics — task success, cost per request, p95 latency, tokens per node, eval score.
- Drift is quality change without a deployment: hosted models update, the web moves, tools change. Scout meets source drift by construction.
- Continuous evaluation = the Module 8 harness on a schedule against the live agent: fixed subset, same judge, scores tagged by version, alert under a threshold.
- Version prompts, config, and code — stamp all three onto every trace; “benchmark against prior versions” becomes a query, not an argument.
- A green dashboard does not prove a healthy agent. Write the runbook before the incident.
Keep going
Want the full NCP-AAI question bank (150+ exam-style questions) and the next module in your inbox? Subscribe here — it’s free, like everything in this series.
You now watch Scout with open-source tools — next, we do it the NVIDIA way: profiling with the NeMo Agent Toolkit and putting Nemotron variants head to head on the golden set.
Lab code · Course index · ← Module 10 · Module 12 →
References
- Langfuse Python SDK (v4) —
the lab’s SDK; see also the
OpenAI drop-in integration
used in
scout/llm.py. - LangSmith observability concepts — successor to the tracing-concepts reading the official study guide recommends for this domain.
- A Guide to Monitoring Machine Learning Models in Production — NVIDIA Technical Blog; official study-guide reading for Domain 8 (functional vs. operational monitoring).
- OpenTelemetry: Traces — the trace/span vocabulary; the standard under Langfuse v4.
- NCP-AAI certification page — the official blueprint; Run, Monitor, and Maintain is weighted at 5%.